Data science scrums down with sports analytics
The spectators of the men’s and women’s Varsity rugby matches between Oxford and Cambridge Universities at Twickenham Stadium in early December had unprecedented insight into the heart of the game.
Due to a partnership between Metapraxis, a financial analytics firm, and Sportable, a wearable sports technology company, those watching the men’s game were able to see, in real-time, the amount of power generated and inflicted during the scrums.
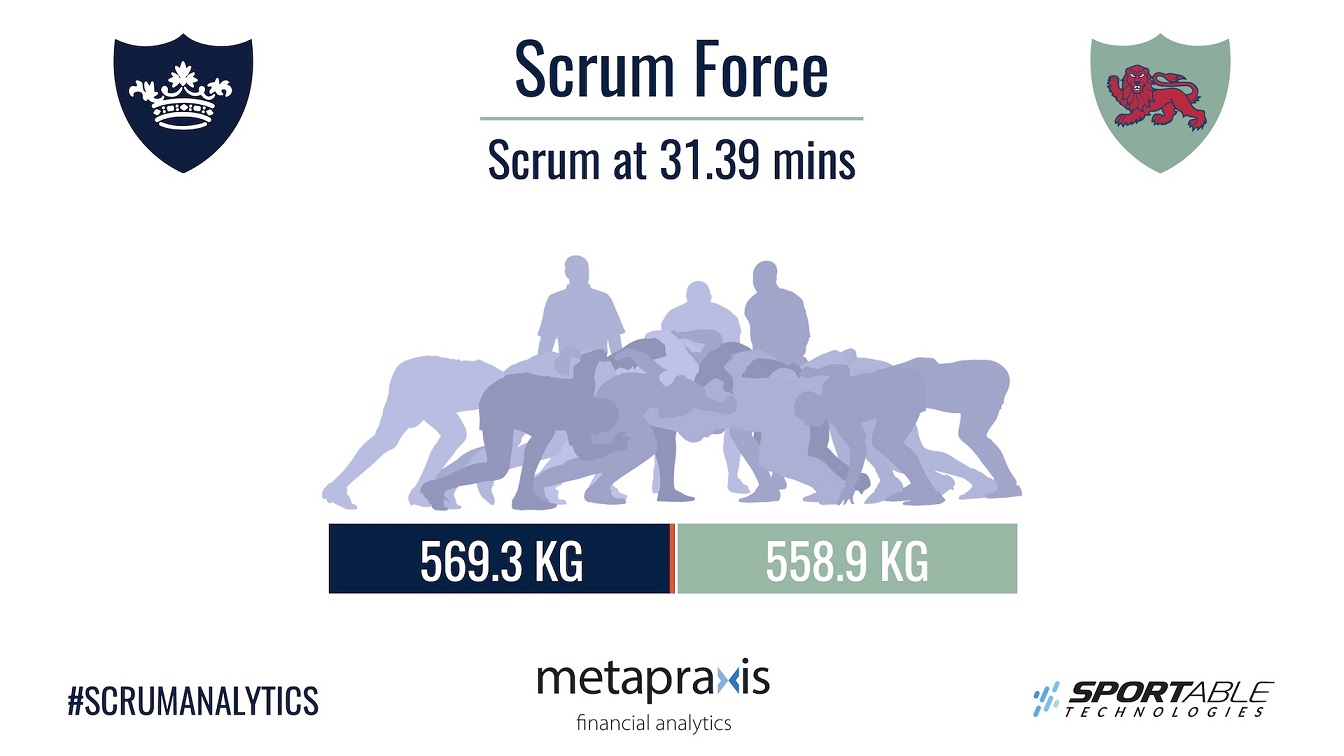 Sportable’s wearable sports technology was integrated into the jerseys of the players to capture both static and dynamic player data, which was then visualised in real time by Metapraxis.
Simon Bittlestone, managing director of Metapraxis, told DataIQ the principle aim was to drive up fan engagement, but added that there are other potential areas, across all sports, that can benefit from the analysis and visualisation of dynamic player-generated data. Those areas are player health, player performance and tactical game understanding.
"Scrums are probably the hardest area of rugby for spectators to understand."
Bittlestone said that data can help with fan engagement in rugby because scrums are probably the hardest area of a game for a spectator to understand. Lots of infringements can take place in a scrum, such as dropping a shoulder or pushing too soon. “To really understand who caused it, you need to understand power exerted,” he said.
In terms of player health, data on the impact that players receive over the course of years can be monitored. This can help coaches, physios and the players themselves to understand the causes and effects of long-term injuries.
He also said that if coaches are able to see in real-time which players are dominating which parts of the field, who has taken a lot of hits and who might be tiring, they can adjust their tactics to the current condition of their team.
 Duncan Locke, senior performance analyst at the RFU, detailed the way in which he and his team collect data for tactical game understanding at the DataIQ Future conference.
The RFU uses data from broadcaster cameras, an audio stream that allows them to hear the referees communicating and GPS units so they can track the players.
Locke said that the analysis of this data - getting the data, making sense of it and feeding it back to key decision-makers - can happen at the side of the field or in the analyst’s home. The amount of data they are working with is vast. Last season, he and his team spent 5,500 hours analysing data collected by the RFU, which amounted to 1.3 million rows of data.
"Teams fall into one of five spikes for their playing style."
To make sense of it, he said they utilise data science and machine learning techniques. Cluster analysis is applied to data collected over eight years on the style of play of different teams.
“It’s like a Christmas bauble with five spikes pointing out. Each team falls into one of those spikes in terms of how they play. Each style of play is more and less successful against another style of play. In theory, you can end up using science as an objective measure to help inform player selection,” Locke explained.
The English Institute of Sport defines performance analysis as “a specialist discipline involving systematic observations to enhance performance and improve decision making, primarily delivered through the provision of objective statistical (data analysis) and visual feedback (video analysis).”
 Locke said one of the reason data and video analysis are necessary in sports matches is that (human) coaches are fallible. He cited studies which found that football coaches could only recall between 30% and 50% of key indicators of successful performance.
He also said: “Personal thinking and emotions get in the way of logic and objective measure. We are a filtering process for coaches and management to make better decisions.”
By providing coaches and players with evidence and feedback from data and video, it enables them to plan training, tactics and select a team with the most informed dataset.
Both sports performance analysis experts said that these techniques and data gathering could be used beyond the game of rugby.
Bittlestone said that now one cannot understand Formula One without understanding elements of data and analytics.
Locke gave an example of how a British cyclist at the Rio 2016 games was saved from disqualification and went on to win a gold medal thanks to two Team GB analysts in the stands whose camera detected that no offence had been committed.
"In all forms of sport data and analytics helps to uncover the story and explain it for a much wider group."
In the future, Bittlestone said he believes there will be a substantial increase in fan engagement. “In all forms of sport, data and analytics can be of real value because it helps to uncover the story and explain it for a much wider group.”
For Locke, we are on the road to enabling decisions to be made at an increasingly faster rate. “We can make really quick and informed insights from the data ,as opposed to historically taking weeks and weeks and weeks.”
Did you find this content useful?
Thank you for your input
Thank you for your feedback

You may also be interested in


DataIQ is a trading name of IQ Data Group Limited
10 York Road, London, SE1 7ND
Phone: +44 020 3821 5665
Registered in England: 9900834
Copyright © IQ Data Group Limited 2024